1. Introduction
In modern industrial facilities, gas turbine compressors are considered critical assets that directly impact production availability, operational efficiency, and maintenance cost. Unexpected failures of rotating equipment such as gas turbine compressors may lead to significant production losses, emergency shutdowns, and high repair expenses.
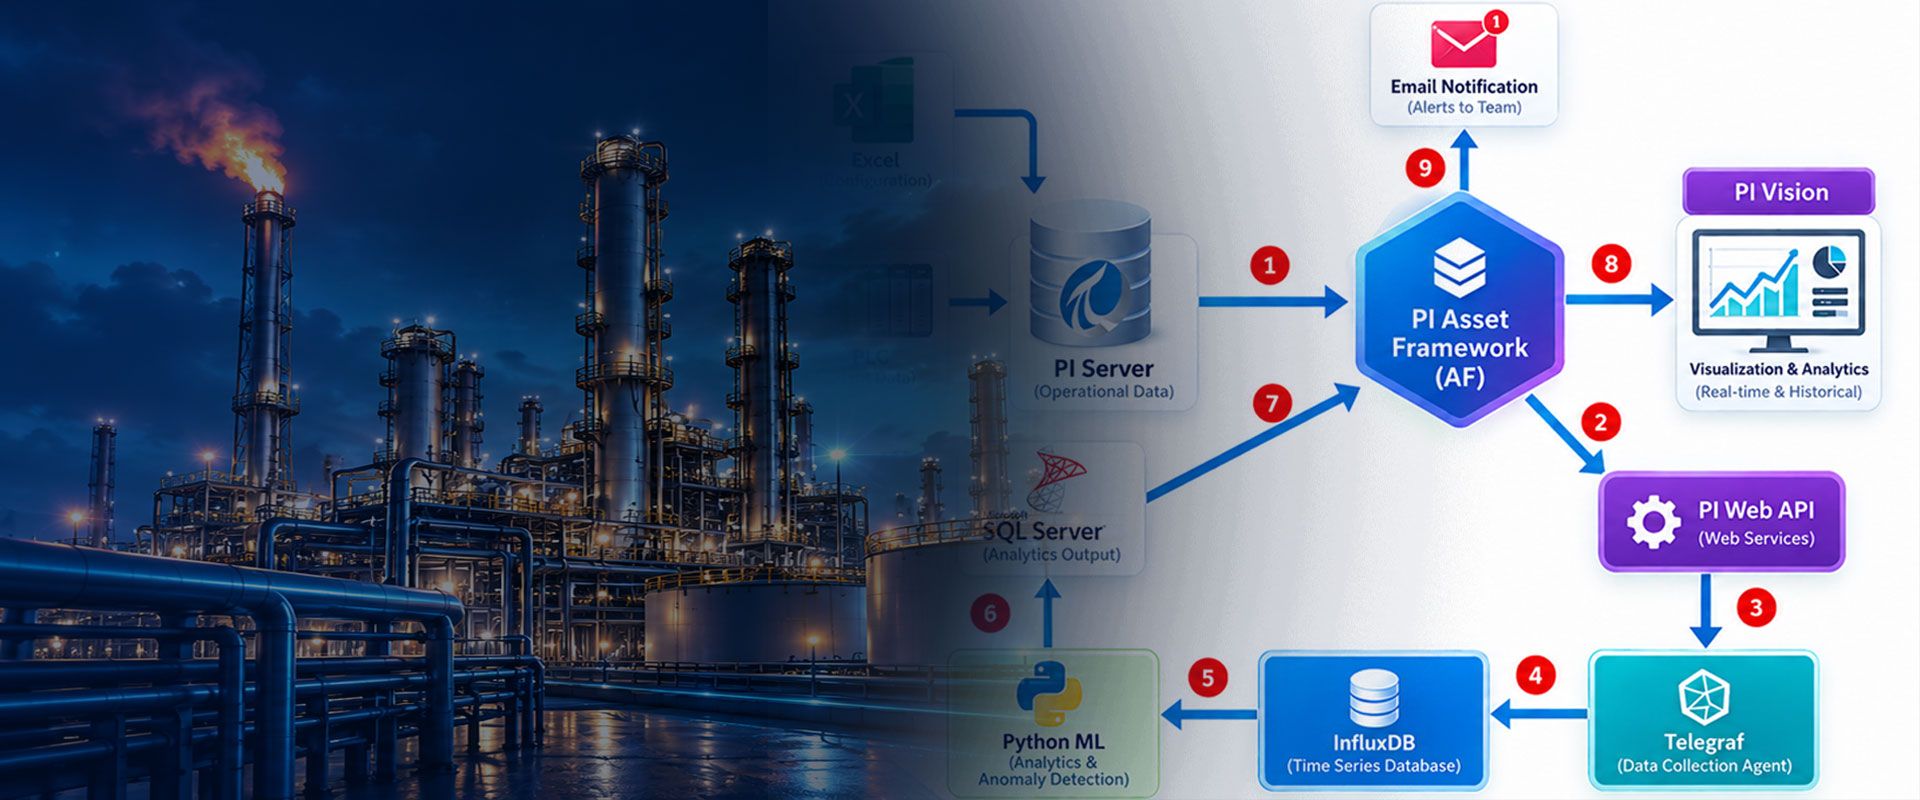
To improve asset reliability, a predictive maintenance approach was implemented by integrating the AVEVA PI System, PI Asset Framework (AF), PI Web API, InfluxDB, and Machine Learning (ML) models developed using Python.
This solution enables continuous monitoring of compressor operating conditions, automatic anomaly detection, and early identification of potential equipment degradation before failure occurs.
The architecture combines industrial historian capabilities with advanced analytics, creating an end-to-end pipeline from real-time process data acquisition to machine learning-based health assessment.
2. Project Objective
The main objectives of this implementation are:
- Develop a standardized Gas Turbine Compressor Asset Model based on ISO 14224 reliability data structure.
- Utilize historical and real-time operating data stored in the AVEVA PI System.
- Enable automated data extraction through PI Web API.
- Perform advanced analytics and anomaly detection using Python Machine Learning algorithms.
- Provide visualization of equipment condition through PI Vision dashboards.
- Generate automatic notification to reliability teams when abnormal conditions are detected.
3. Solution Architecture Overview
The implemented solution consists of several integrated layers:
1. Data Acquisition Layer
2. Asset Information Layer
3. Data Integration Layer
4. Machine Learning Analytics Layer
5. Visualization and Notification Layer
The overall workflow:
4. Asset Modeling Using PI Asset Framework (ISO 14224)
The first stage of implementation is developing a structured asset model for the gas turbine compressor using AVEVA PI Asset Framework (AF).
The asset model follows the principles of ISO 14224, which provides a standardized hierarchy for equipment reliability data management.
Each equipment object is associated with:
- Equipment identification
- Operating parameters
- Design information
- Maintenance attributes
- Reliability indicators
- Health monitoring parameters
Example compressor monitoring attributes:
This asset model provides a contextual relationship between raw process tags and physical equipment.
5. Data Storage and Historian Integration
AVEVA PI Server
The AVEVA PI System acts as the primary industrial historian.
Data sources:
- PLC/DCS systems
- Field instrumentation
- Control systems
- Condition monitoring systems
Real-time process data is continuously collected and stored in PI Data Archive.
Example:
The historian provides:
- High-speed time-series storage
- Data compression
- Event-based recording
- Historical data retrieval
6. Data Access Through PI Web API
To enable external analytics applications, the solution uses PI Web API as an integration gateway.
PI Web API provides REST-based access to:
- PI Tags
- Asset Framework objects
- Historical values
- Current values
- Calculated attributes
Python applications can retrieve compressor operating data without direct access to the PI database.
Advantages:
- Secure data access
- Standard web-based communication
- Easy integration with analytics platforms
7. Data Streaming Using Telegraf
A lightweight data collector agent, Telegraf, is implemented to continuously collect data from PI Web API.
The workflow:
Telegraf performs:
- Scheduled data extraction
- Data formatting
- Timestamp synchronization
- Data forwarding
This allows PI historian data to be replicated into an analytics-oriented time-series database.
8. Analytics Database Using InfluxDB
InfluxDB is used as a high-performance time-series database for machine learning processing.
Advantages:
- Optimized time-series query performance
- High-frequency data handling
- Efficient storage for analytics workloads
Data structure example:
InfluxDB acts as the intermediate analytics data platform between PI System and Python ML models.
9. Machine Learning Analytics Using Python
The machine learning layer performs equipment health assessment and anomaly detection.
Python retrieves compressor data from InfluxDB using tag-based queries.
Example analytics process:
Machine Learning Applications
1. Anomaly Detection
The model identifies abnormal operating patterns.
Example:
The model detects deviation from normal operating behavior.
2. Equipment Health Score
A health index is calculated based on multiple parameters:
Example:
Health Score=f(Vibration,Temperature,Pressure,Efficiency)Health\ Score = f(Vibration, Temperature, Pressure, Efficiency)
Output:
3. Predictive Maintenance
Machine learning models can estimate degradation trends:
Example:
The system predicts when vibration may exceed allowable limits.
10. Analytics Result Storage
After processing, Python stores analytical results into SQL Server.
Stored information includes:
- Health index
- Anomaly score
- Prediction result
- Equipment condition
- Maintenance recommendation
Example database:
11. Integration Back to PI Asset Framework
The analytical results are integrated back into PI Asset Framework.
Additional AF attributes:
This enables operators and reliability engineers to view both:
- Actual operating condition
- Machine learning prediction results
within the same PI environment.
12. Visualization Using PI Vision
PI Vision dashboards provide visualization for operations and maintenance teams.
Dashboard examples:
Compressor Overview
Displays:
- Running status
- Health score
- Critical parameters
- Alarm status
Condition Monitoring Dashboard
Displays:
- Vibration trend
- Temperature trend
- Pressure performance
- ML anomaly indicator
Example:
13. Automated Anomaly Notification
When abnormal conditions are detected, the system automatically sends notifications.
Workflow:
Example notification:
14. Business Benefits
The implemented solution provides several operational benefits:
Improved Asset Reliability
Early detection of equipment degradation reduces unexpected failures.
Reduced Maintenance Cost
Maintenance activities can shift from reactive maintenance to predictive maintenance.
Better Decision Making
Reliability engineers receive data-driven recommendations.
Integration Between OT and IT
The solution bridges:
- Industrial control systems
- Historian platforms
- Data analytics
- Machine learning applications
15. Conclusion
The integration of AVEVA PI System, PI Asset Framework, PI Web API, InfluxDB, and Python Machine Learning provides a comprehensive platform for gas turbine compressor health monitoring.
By combining industrial historian technology with advanced analytics, organizations can transform operational data into actionable reliability insights.
This architecture enables:
- Real-time equipment monitoring
- Automated anomaly detection
- Predictive maintenance capability
- Improved operational availability
- Reduced risk of unexpected equipment failure
The solution represents a practical implementation of Industrial AI and Asset Performance Management (APM) for critical rotating equipment in oil & gas, power generation, and process industries.
Jerry A Sevianto's profile on LinkedIn
Jerry A Sevianto | Business Development Manager @ PT SCADA PRIMA CIPTA | AVEVA PI System, Rockwell PlantPAx, Rockwell Thin Manager, FactoryTalk Data Mosaic
About
With over 24 years of experience at PT SCADA PRIMA CIPTA, I specialize in Oil & Gas Automation and SCADA systems, contributing to transformative projects for prominent energy clients. My expertise includes system integration, predictive analytics, and process optimization, supported by certifications in FactoryTalk Data Mosaic, Rockwell ThinManager, and Rockwell PlantPAx.
As Business Development Manager, I focus on delivering advanced automation solutions that drive operational excellence and efficiency. My work bridges cutting-edge technologies with client needs, enabling impactful outcomes and fostering innovation within the industry.
Skills
- FactoryTalk Data Mosaic
- Rockwell Thin Manager
- Rockwell PlantPAx
- Aveva PI System
- Wonderware InTouch
- Wonderware InSQL Server
- OPC Server
- PLC PlantPax
- Controllogix 5000
- FactoryTalk Asset Centre (FTAC)
- Control Logic
- Wonderware
- PLC
- DCS
- FactoryTalk
Interested in discussing how a similar solution could be applied at your facility? Connect with us on LinkedIn:
https://www.linkedin.com/in/jerry-a-sevianto-70b8103b/ or https://www.linkedin.com/company/pt-scada-prima-cipta/