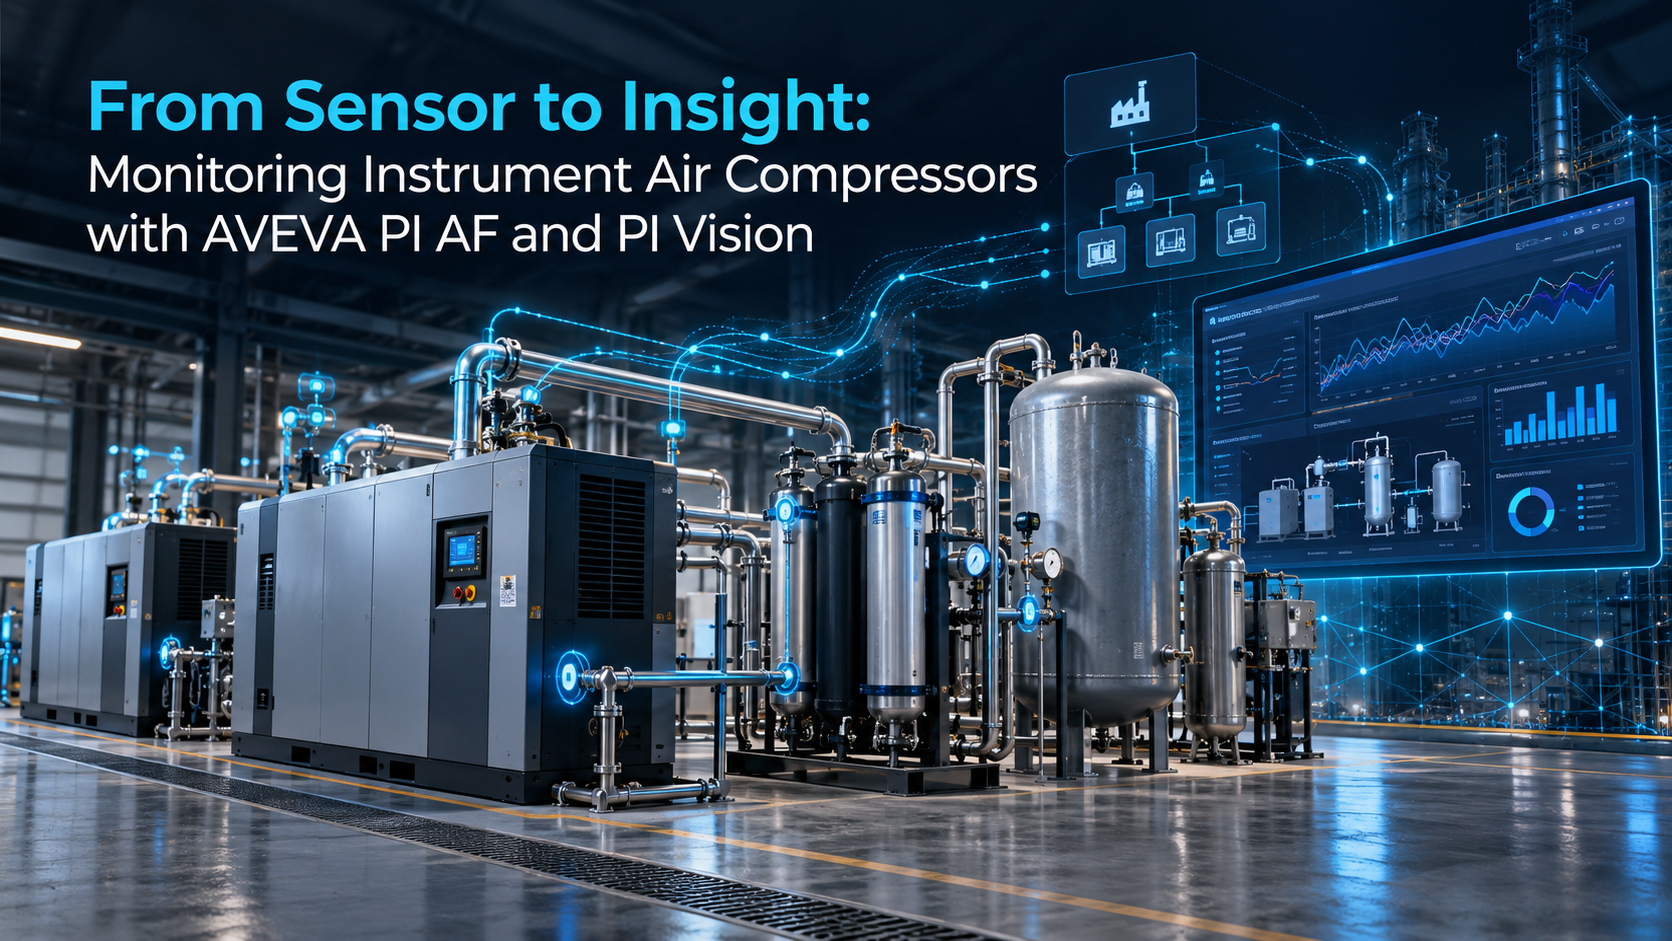
From Sensor to Insight: Monitoring Instrument Air Compressors with AVEVA PI AF and PI Vision
PT Scada Prima Cipta (SPC) · AVEVA PI System
Instrument air rarely gets attention until it fails. Yet almost every pneumatic control valve, actuator and analyzer in a plant depends on it. When pressure drops or air quality slips, the whole process feels it. That makes the instrument air compressor one of the most critical utilities on site, and one of the best candidates for structured, real-time monitoring.
This short walkthrough shows how the AVEVA PI System turns raw compressor signals into an organized asset model, calculated performance indicators and a live operations dashboard in five steps.
1. Instrument Air: A Critical Utility
The example system is made up of four functional groups:
- Compressor Station: Compressor 01, 02 and 03
- Air Dryer: Dryer 01 and 02
- Air Receiver: Receiver 01 and 02
- Distribution: Header and User Points
Monitoring the whole chain, not just the compressors, gives operators the full picture from air generation to the point of use.
2. PI AF: A Digital Asset Hierarchy
In AVEVA PI Asset Framework (PI AF), the same structure becomes a digital asset model. Each piece of equipment is an element under the Instrument Air System hierarchy. Compressor 01, for example, is defined with:
- Description: Instrument Air Compressor
- Category: Compressor
- Template: IA Compressor
- Status: In Service
Because every compressor is built from the same IA Compressor template, attributes, analyses and notifications are configured once and applied consistently to every unit. Adding a new compressor becomes a quick configuration task, not a new engineering effort.
3. Real-Time Data: From Sensor to Asset Context
Field instruments on the compressor package feed live values into the PI Data Archive. PI AF then maps each tag to its asset, so users see "Compressor 01 – Discharge Pressure" rather than a bare tag name. The example in the video uses the following signals:
4. PI AF Parameters, Formulas and Calculations
With the raw data in context, PI AF analyses calculate standardized performance indicators directly from the attributes. Examples shown in the video include:
Specific power is the key indicator here: it shows how much electrical energy is needed for each unit of compressed air. A rising trend points to leaks, fouling, poor load sharing or worn components, well before they become a trip.
5. PI Vision: Real-Time Performance Monitoring
The results are presented in an AVEVA PI Vision "KPI Process – Equipment Performance" display for Compressor 1. In one screen, users can see:
- Live gauges against target: Power 974.94 kW (target 1,020 kW), Flow AP 220.80 Nm³/min (target 260 Nm³/min) and USRT CTW 630.41 USRT/h (target 1,040 USRT/h).
- Totalizers: Electric 2,124 kWh, Totalizer AP 28,871 Nm³ and Totalizer CTW 1,362.79 USRT.
- Trends: 8-hour trends of Flow (Nm³/min) and Power (kW/Nm³/min) plotted against their target lines.
- Monthly totalizer table: power (kWh) and air flow (Nm³) by month for long-term energy and production tracking.
The same display sits within a wider KPI navigation (KPI Factory, KPI Dept, KPI Utility, KPI WWT and KPI Process), so asset-level KPIs roll up naturally to plant-level reporting.
Beyond the Dashboard
A dashboard is only the start. Once data is contextualized and KPIs are standardized in PI AF, the same foundation supports the full value chain:
Data → Asset Context → Visualization → Prediction → Maintenance Action
Trends in specific power, running hours and load/unload behaviour can feed predictive analytics and condition-based maintenance. This moves the team from reacting to compressor trips to planning interventions before reliability is affected.
How SPC Can Help
As an AVEVA and Schneider Electric system integrator partner based in Bandung, PT Scada Prima Cipta (SPC) designs and implements PI System solutions for oil & gas, geothermal, power and manufacturing facilities across Indonesia. These include PI AF asset modeling, analytics configuration and PI Vision dashboards. If you want better visibility of your utility systems, contact our team to discuss your requirements.
